Reader
ScienceStack Reader transforms arXiv papers into an interactive reading experience. No more PDFs — just clean, navigable documents with hover previews, annotations, and structured exports.
See it in action
Featured: Language Models are Injective and Hence Invertible
Features
Hover Citations
Preview any citation, equation, or figure without losing your place. No more jumping back and forth.
Annotations
Highlight text and add notes directly on papers. Your annotations sync across all your devices.
Dependency Graphs
Visualize how equations, theorems, and definitions connect. Understand paper structure at a glance.
Export Anywhere
Download as Markdown, JSON, or LaTeX. Perfect for note-taking apps, LLMs, and research workflows.
Mobile Ready
Read papers on any device. Responsive design that adapts to phones, tablets, and desktops.
Dark Mode
Easy on the eyes for late-night reading sessions. Toggle between light and dark themes.
Quick Start
Browse papers: Head to Explore to search 150k+ arXiv papers by topic, author, or arXiv ID.
Upload your own: Go to My Library → Uploads to upload your LaTeX source files. Papers are private by default.
Keyboard shortcuts: Press ? while reading any paper to see available shortcuts.
Free for readers. Reading, annotations, dependency graphs, and exports are all free. No account required to browse papers.
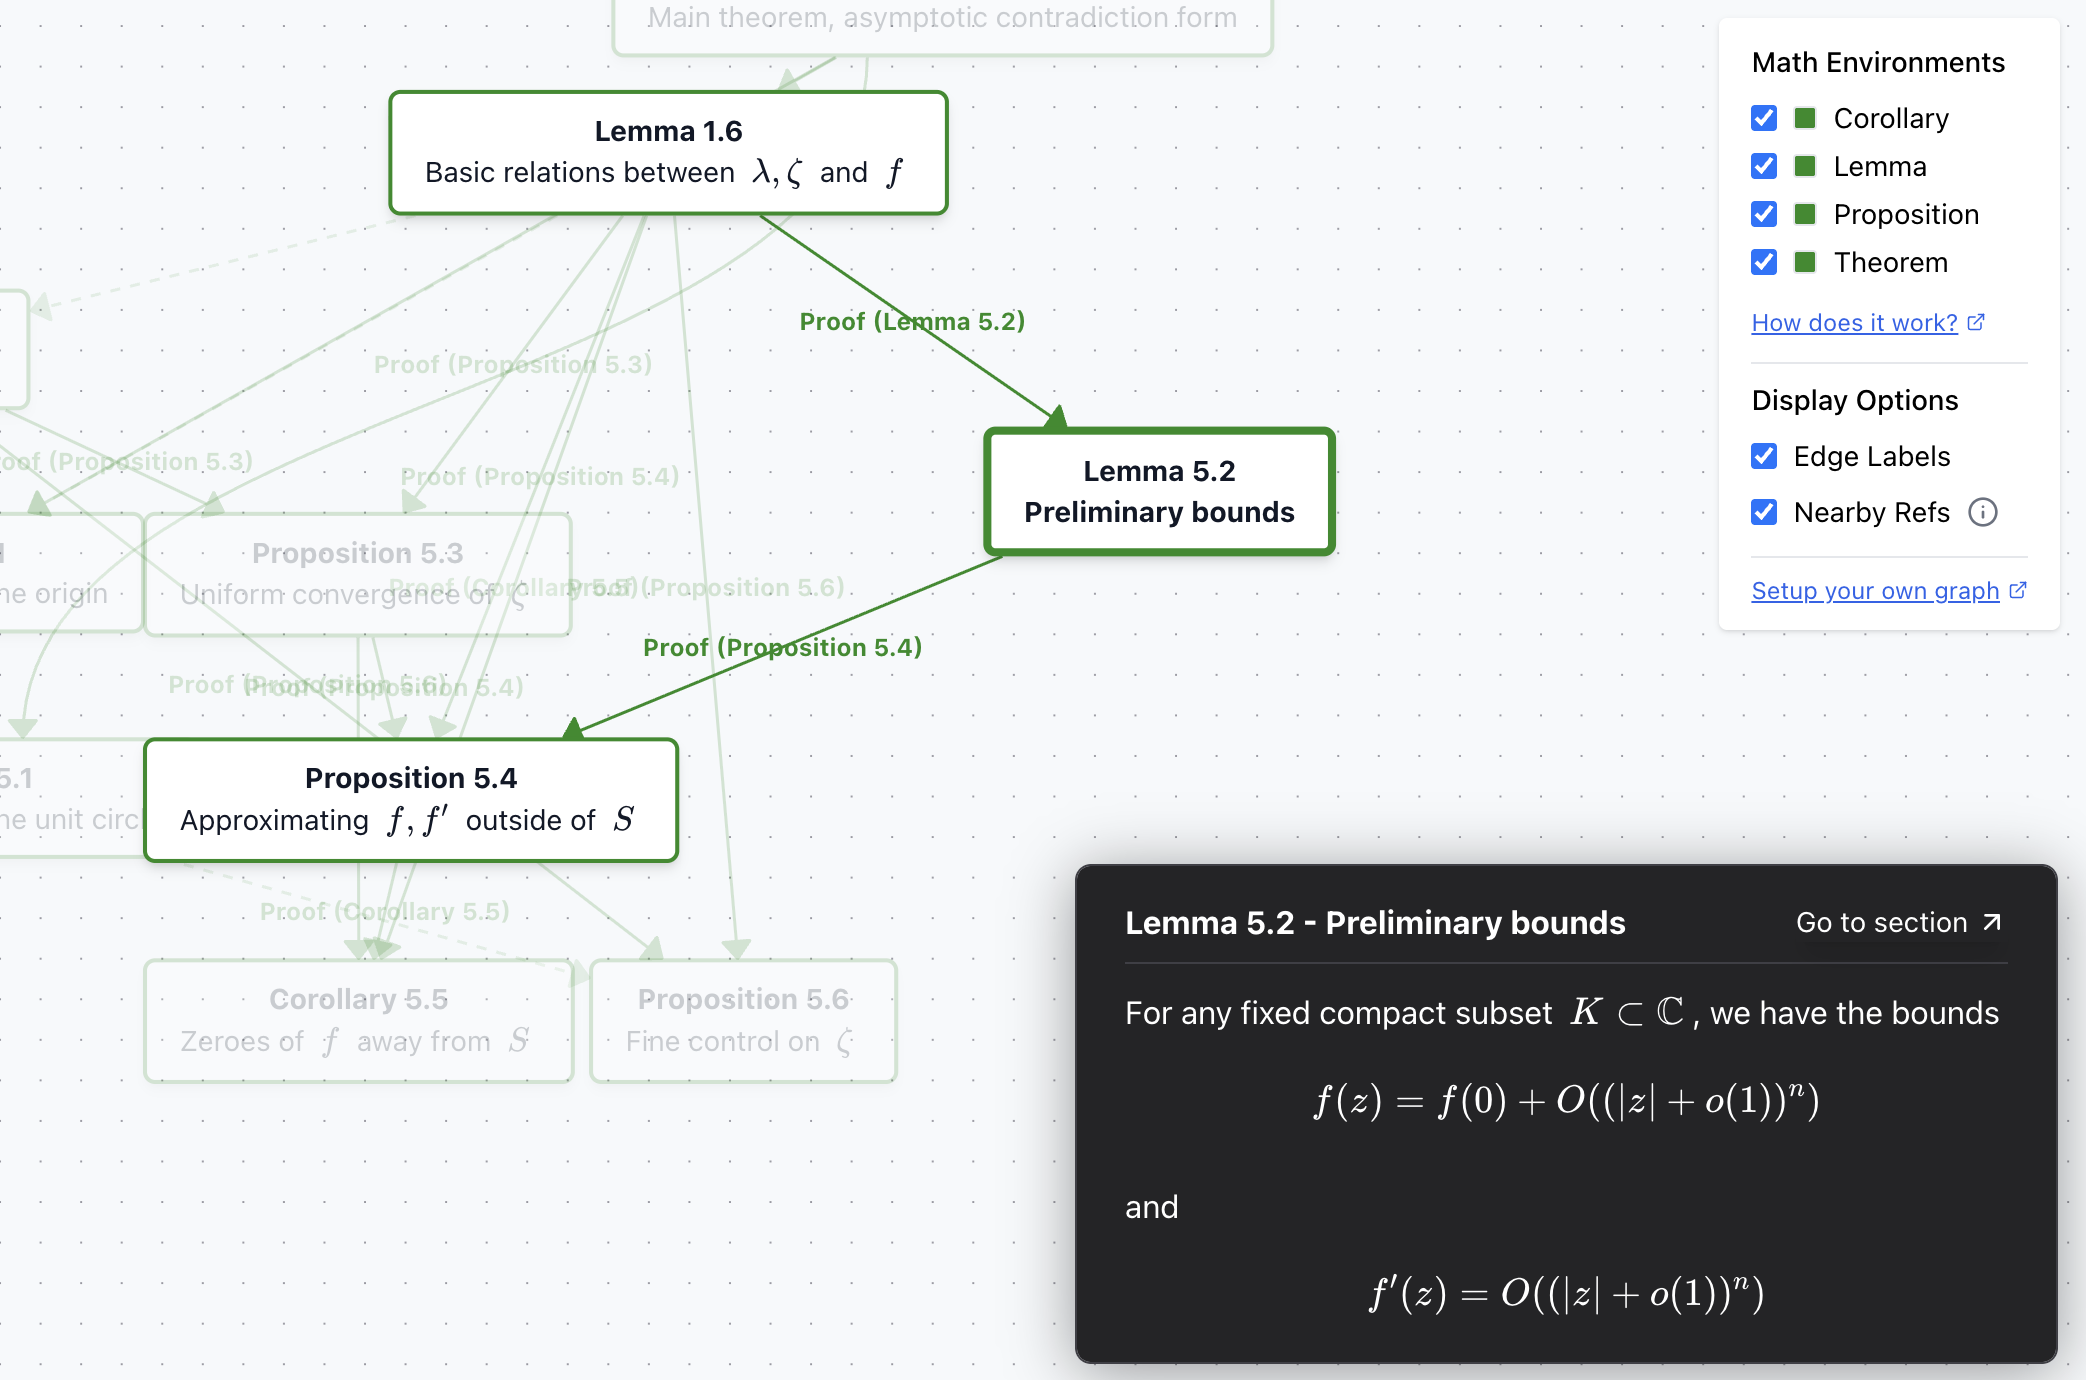
Dependency Graphs
ScienceStack automatically generates math dependency graphs directly from LaTeX source files. The process is fully automated — no custom packages required — and works with simple \ref and \label commands.
This was inspired by Terence Tao's blog post Would it be possible to create a tool to automatically diagram papers?
Example graph from the paper "Sendov's conjecture for sufficiently high degree polynomials"
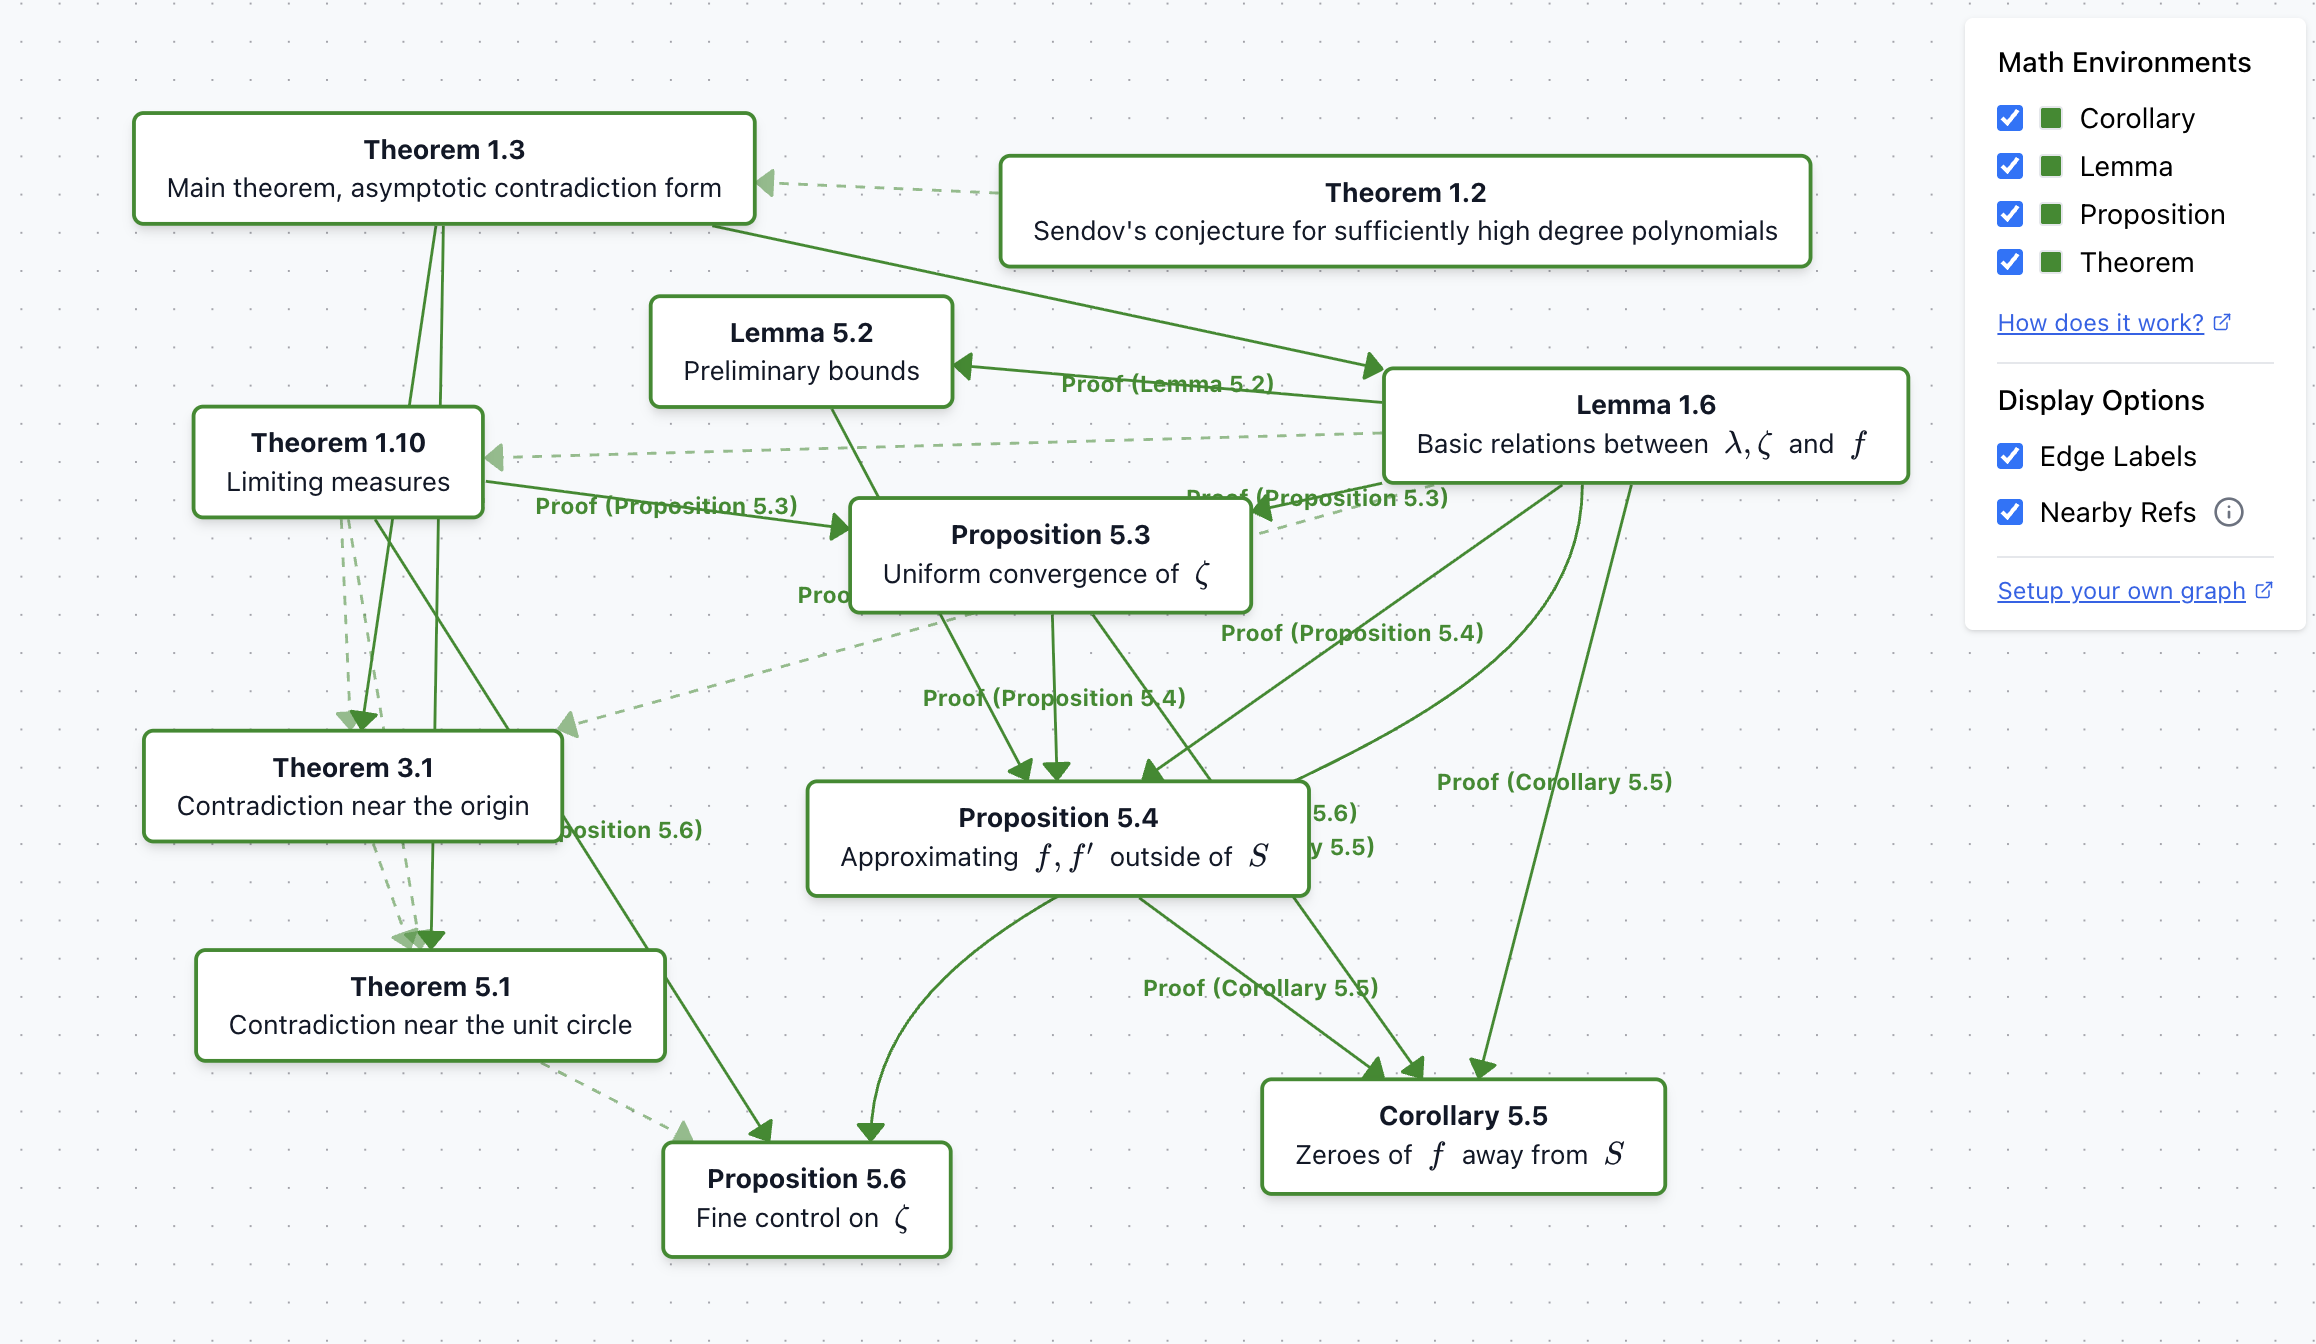
The graph is fully interactive — you can drag nodes around to reorganize the layout and better understand the relationships between mathematical concepts.
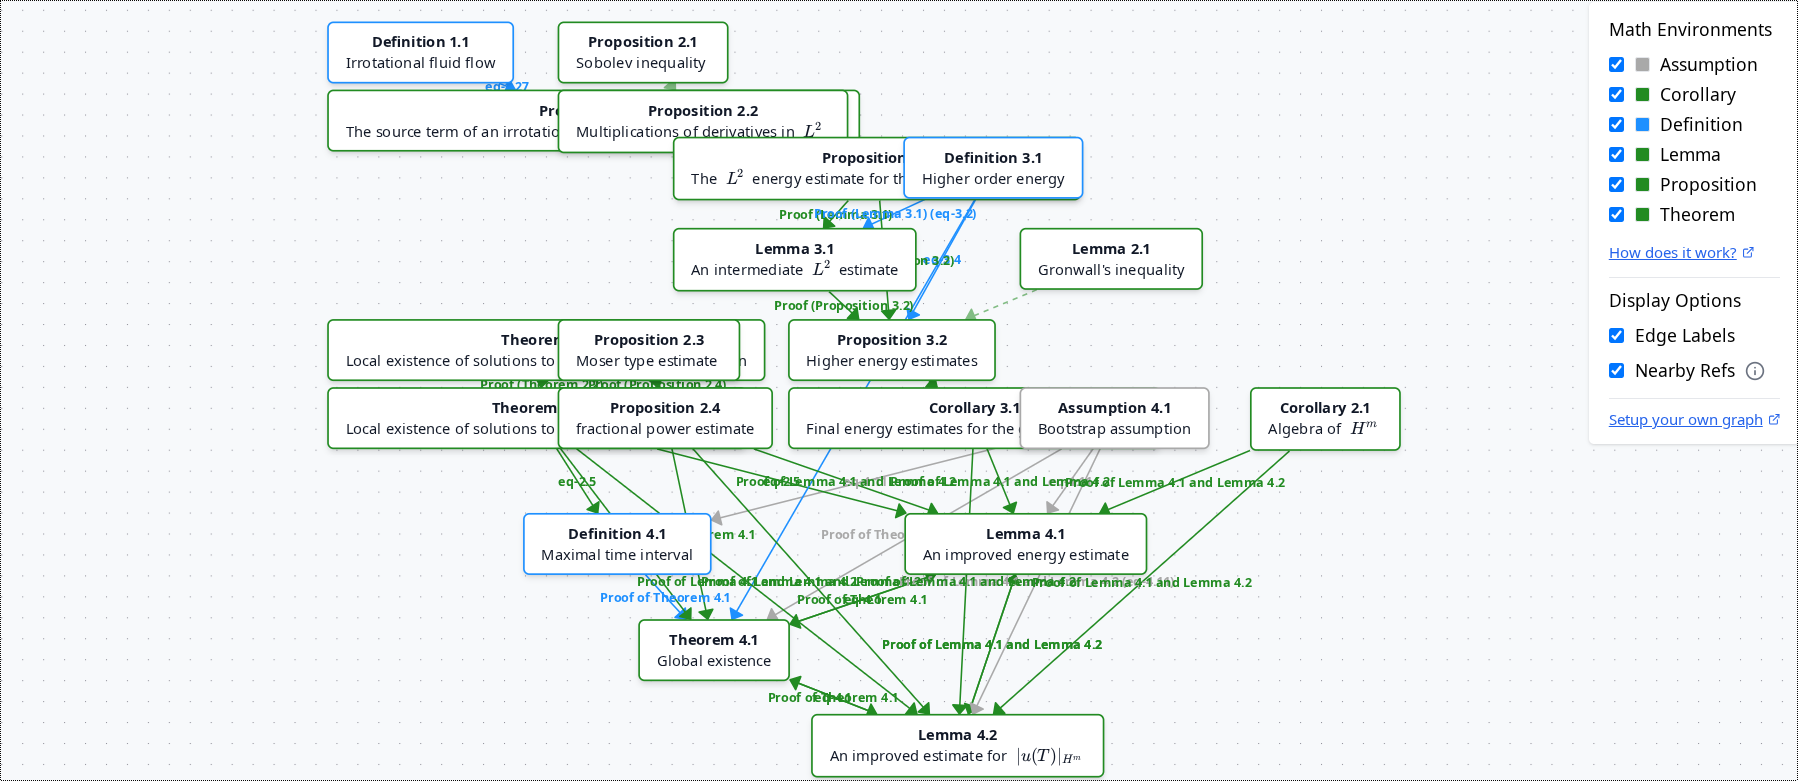
Before
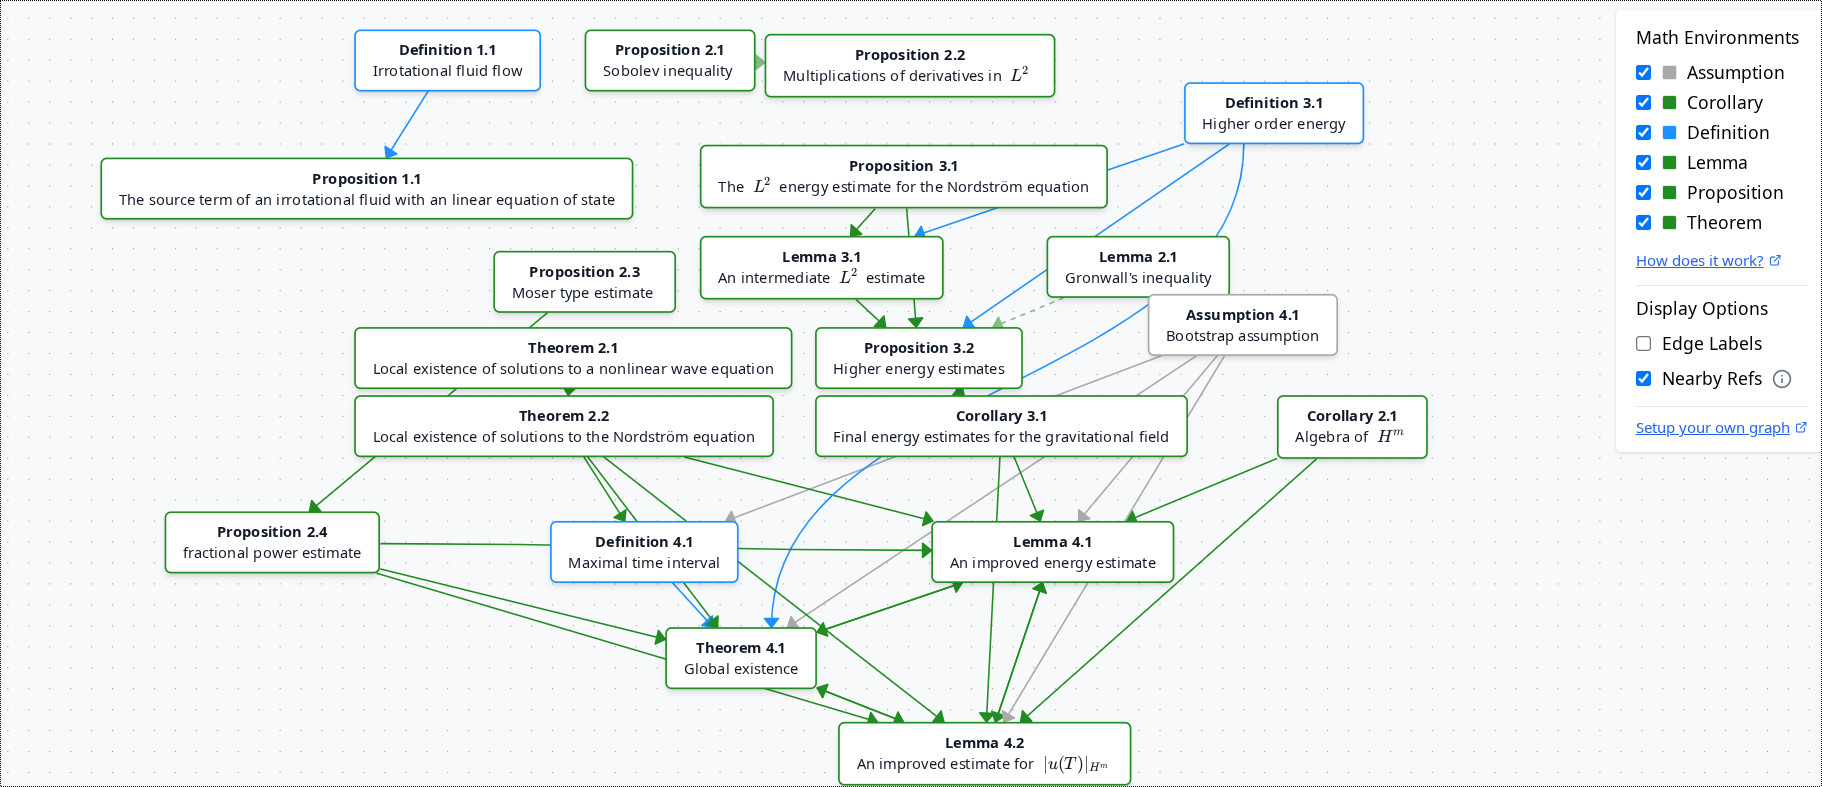
After
How It Works
The system detects connections between \newtheorem blocks and references, then visualizes them in an interactive graph. Supports direct references, proofs, section references, equations, and nearby references.
Example 1: Direct links
\newtheorem{thm}{Theorem}
\newtheorem{lem}{Lemma}
\newtheorem{defn}{Definition}

\begin{defn}[Definition A]
\label{defn:a}
\end{defn}

\begin{thm}[Theorem A]
\label{thm:a}
We need \ref{defn:a} to formulate the theorem
\end{thm}

\begin{lem}[Lemma A]
\label{lem:a}
Link to \ref{thm:a}
\end{lem}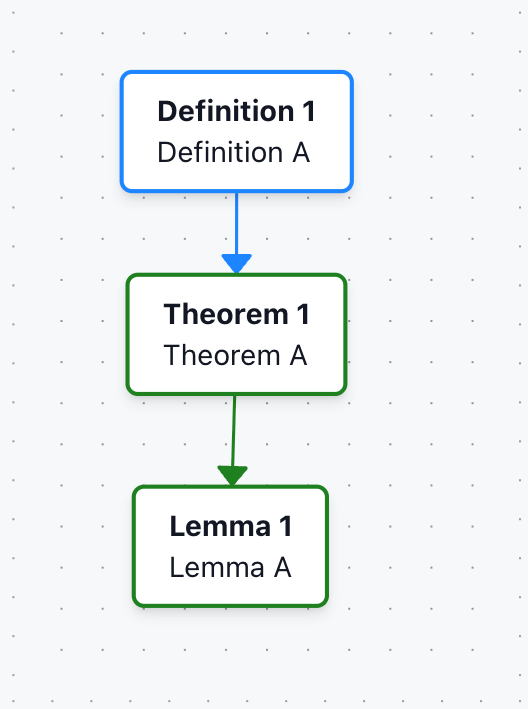
Example 2: Proof blocks
The graph also works with \begin{proof} that immediately follows a newtheorem block (that is not a remark or example).
\begin{lem}[Lemma C]
\label{lemma-c}
\end{lem}

\begin{proof}
% Proof is associated with Lemma C
Uses Definition A \ref{def-a}
\end{proof}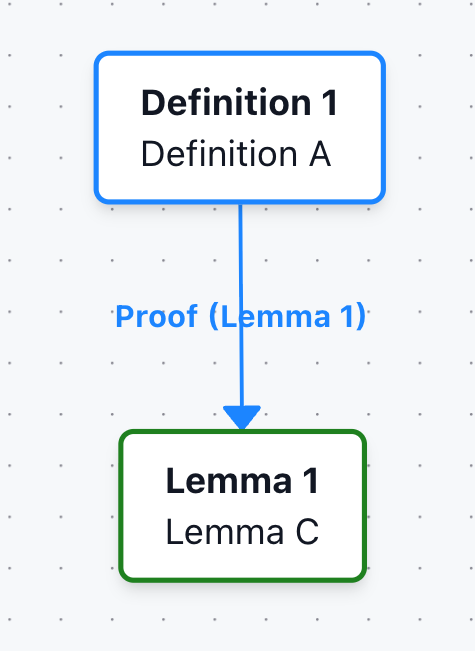
Example 3: Sections with refs
Links can also be established for newtheorem blocks referenced inside \section, \subsection, etc.
\subsection*{Proof of \ref{thm:a} and \ref{thm:b}}
Lemma A \ref{lem:a} creates a link to Theorem A and Theorem B.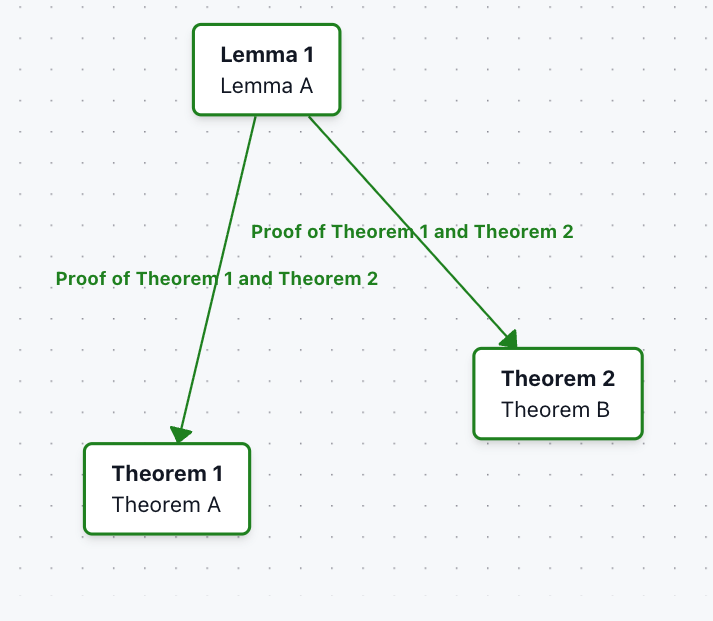
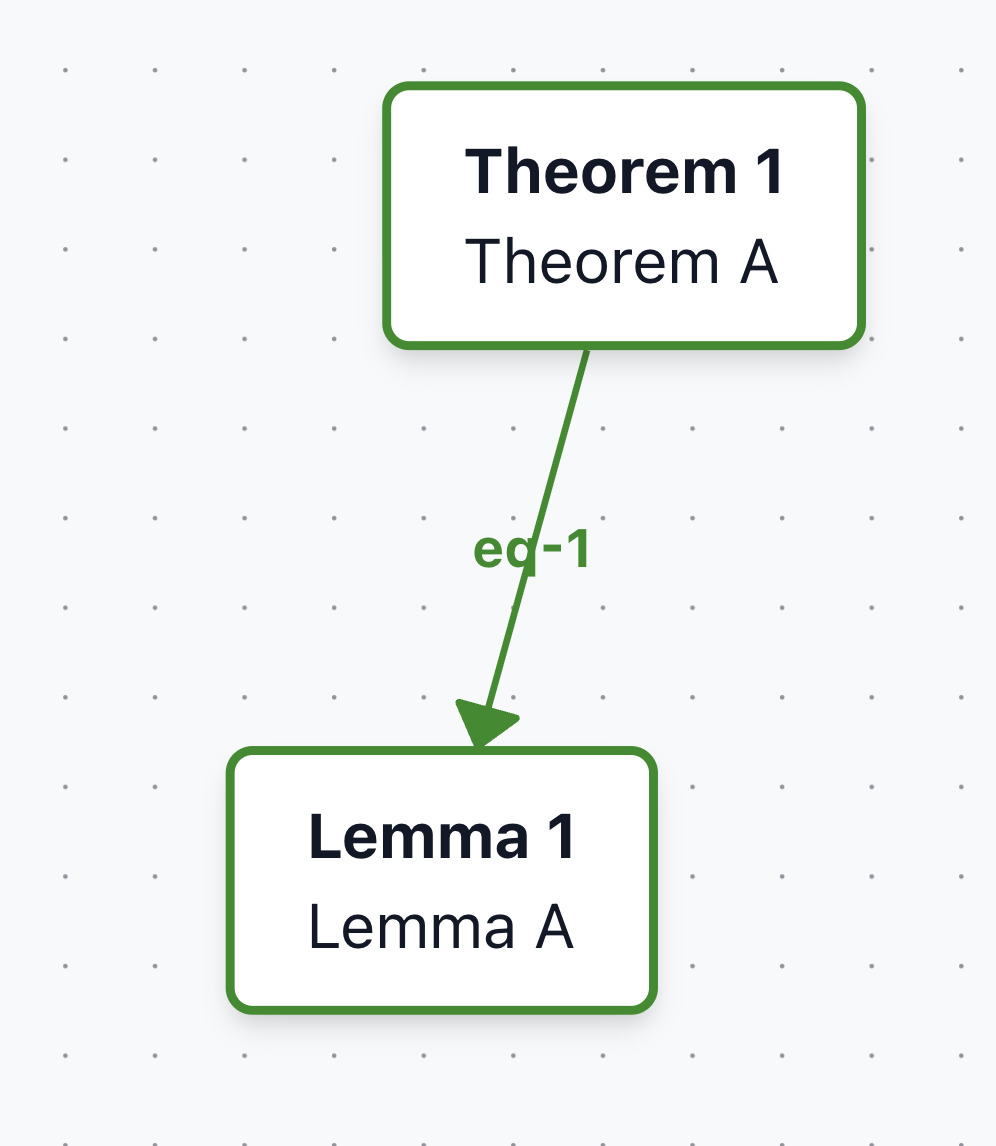
Example 4: Linking by equations
References to equations nested inside newtheorem environments can also be linked.
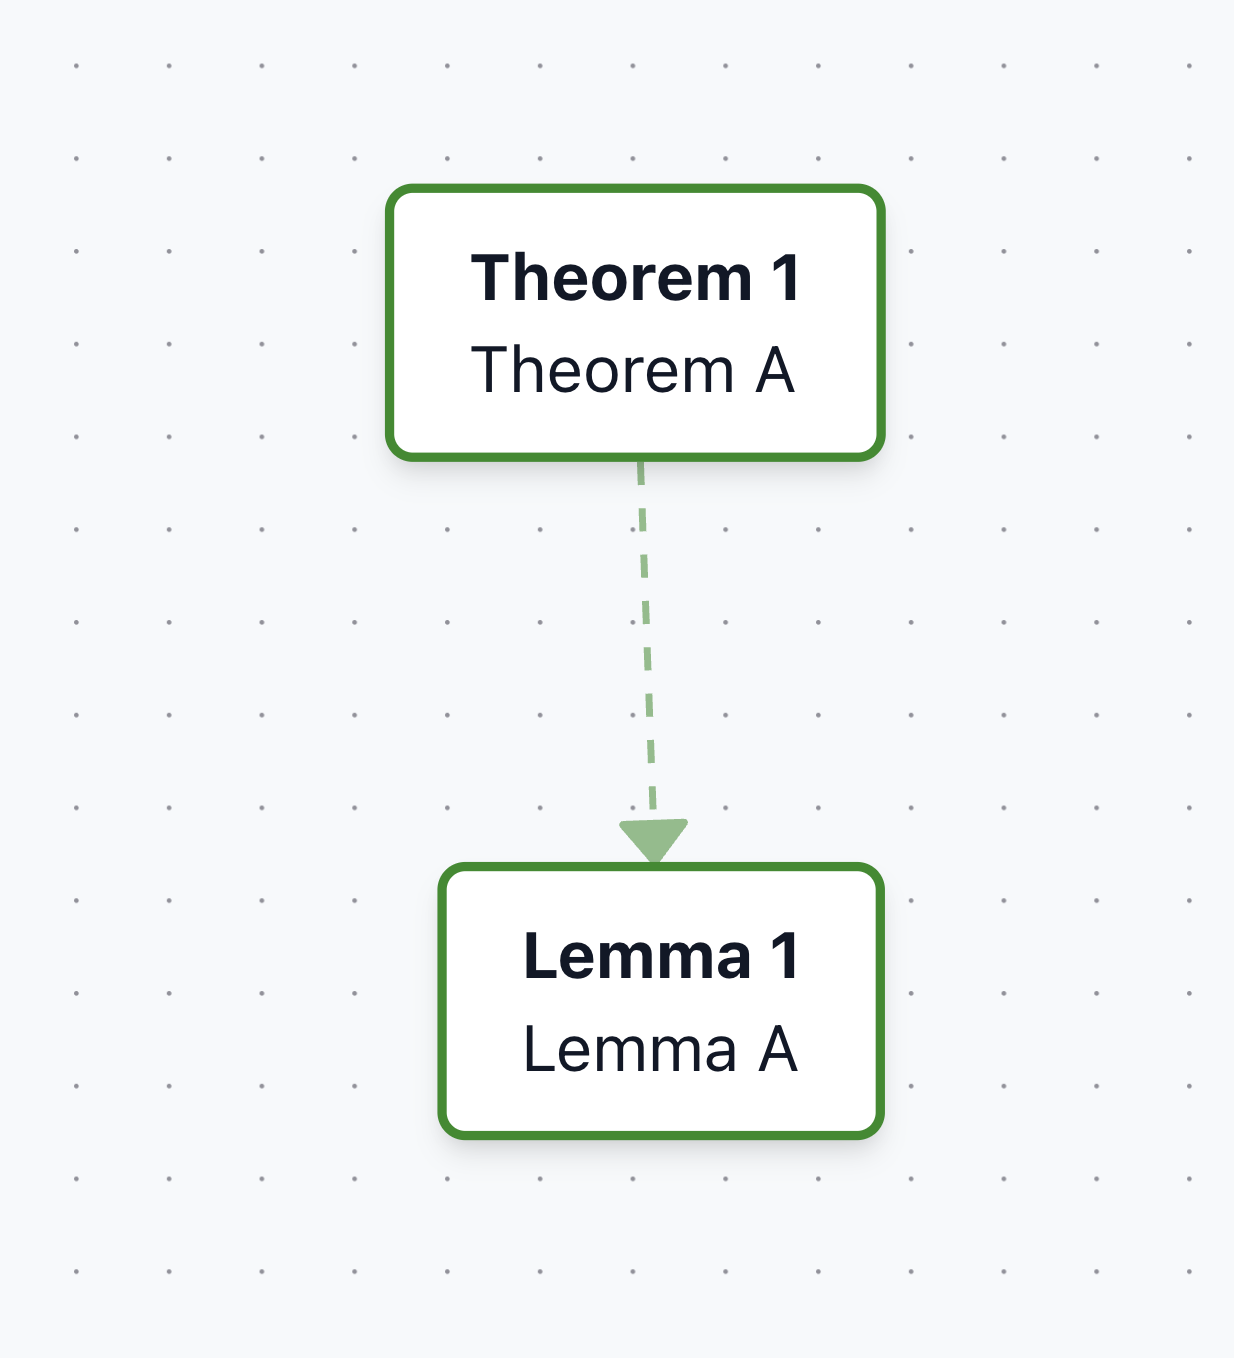
Example 5: Indirect links ("nearby refs")
References that appear immediately outside a newtheorem block are called "nearby refs". These links are dotted and can be toggled on/off.
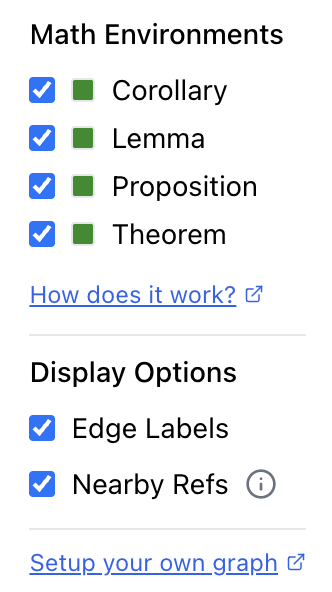
Interface
Panel
The graph interface includes a control panel on the right side that lets you customize the visualization:
- Math Environments: Filter which types of mathematical objects to display
- Display Options: Toggle edge labels and nearby references on/off
Interactive UI
- Hover: Move your cursor over any node to highlight its connections
- Click to Pin: Click on a node to pin it, keeping the node and its dependencies highlighted
Color Coding
- Forest Green: Core mathematical statements (theorems, lemmas, corollaries, propositions)
- Other Colors: Different environments may use different colors (e.g., gray for remarks/examples)
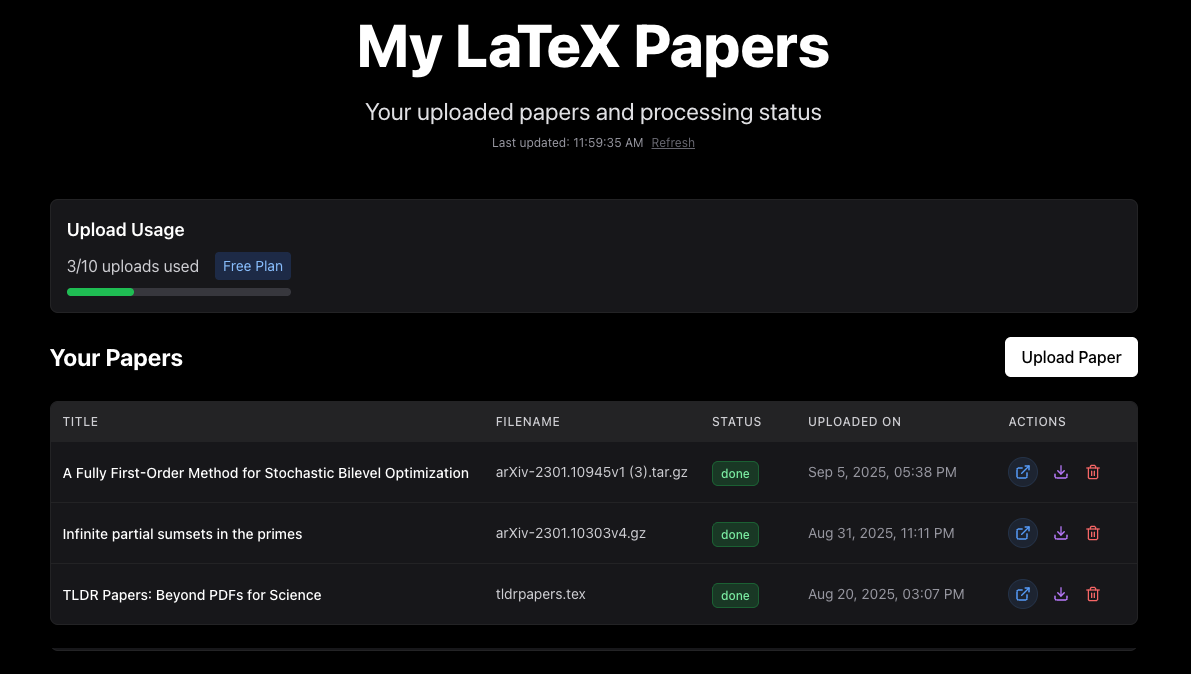
Creating Your Own Dependency Graph
To generate a dependency graph for your own LaTeX paper:
- Upload: Click "My Uploads" and upload your LaTeX source file
- Processing: After uploading, you'll be redirected to your dashboard where the paper will be processed
- View Paper: Once processing is complete, click the blue "View as HTML" button
- Graph Tab: Click on the "Graph" tab at the top to view the dependency graph
Exports
Scientific papers are typically distributed as PDFs — convenient for humans, but terrible for machines, AI, and modern workflows.
ScienceStack transforms LaTeX source into three structured export formats that preserve the full semantic content of research papers:
- Markdown (.md) — Human-readable, works with Obsidian/Notion/VSCode, preserves all numbering
- JSON (.json) — Machine-native, optimized for LLMs and AI pipelines
- LaTeX (.tex) — Raw LaTeX with all macros expanded
The PDF Problem
PDFs flatten rich document structure into visual layouts, stripping away semantic meaning:
- Loss of structure — Sections, figures, theorems, and references are mashed into a page dump
- Broken math — Equations are often extracted incorrectly (superscripts and fractions collapse)
- No semantic cues — Citations appear as [12] instead of links to actual references
- Bad for AI — LLMs waste tokens on noise (line breaks, formatting artifacts)
How to Export
- Navigate to any paper on ScienceStack
- Click the "Download" button in the top-right navigation bar
- Select your preferred format from the dropdown
- Configure options (annotations, assets) and download
Markdown Export
Our Markdown export is purpose-built for research papers and significantly more robust than generic LaTeX→Markdown converters.
Key Features
- Complete numbering preservation — Sections, equations, figures, tables, and theorems all keep their original numbers
- Linkable cross-references — All
\ref{...}commands become live markdown links - Complete asset package Pro — Download with all figures and diagrams in optimized formats
- LLM-friendly annotations — Your notes are embedded as structured JSON in HTML comments
- Works everywhere — Compatible with Obsidian, Notion, VSCode, GitHub
JSON Export
Our JSON format is machine-native and optimized for AI applications, LLM ingestion, and programmatic analysis.
Why JSON Over PDFs for LLMs?
| Problem | Our JSON | |
|---|---|---|
| Math extraction | Corrupted | LaTeX preserved |
| Structure | Flattened | Full semantic tree |
| Numbering | OCR errors | All elements numbered |
Key Properties
- Macros expanded — All
\newcommanddefinitions resolved - Stable IDs — Every block has a unique identifier
- Semantic types — Explicit tags for abstracts, proofs, definitions, etc.
- Resolved references —
\ref{thm:main}links to the actual theorem block
LaTeX Export
Download the raw LaTeX source with all macros expanded and content in the correct order.
What You Get
- Macro expansion — All
\newcommand,\def, and custom commands resolved - Complete content — All
\inputand\includefiles merged in order - Clean formatting — Unnecessary whitespace and comments removed
- Bibliography included — References appended as BibTeX entries
FAQ
How is this different from arXiv HTML or other HTML viewers?
Other HTML renderers (including arXiv's LaTeXML output) are fine for short papers, but on long or equation-heavy documents they can become sluggish, with pages that lag, freeze, or even crash the browser. ScienceStack was built to solve those gaps with virtualized rendering, hover previews, and structured exports.
Is ScienceStack accessible and WCAG compliant?
Yes, ScienceStack is built to be accessible and compliant with WCAG 2.1 AA standards. Mathematical content includes proper alternative text for screen readers, and interactive elements are keyboard navigable.
Can I upload my own papers? Are my LaTeX uploads private?
Yes, you can upload your own LaTeX files through 'My Library' > Uploads. Uploads are private by default, with the option to share or make public if you choose.
Why don't I see some content that appears in the arXiv PDF?
We parse the LaTeX source files that authors upload to arXiv as JSON, then render the JSON as interactive HTML. It's possible that our parser didn't capture certain elements. If you find content that should be displayed but isn't, please email us at support@sciencestack.ai.
How accurate is your platform in preserving equation and section numbers?
Numbering is accurate in most cases, tested across hundreds of ML, physics, and math papers. Edge cases like restatable environments and conditional equation numbering have known limitations.
Do you handle custom .cls and .sty files?
Yes, we support custom class files (.cls) and style files (.sty) for all uploads, as long as they use fairly standard LaTeX constructs.
How is performance on long or heavy papers?
We built the reader with virtualization and caching, so even very long papers (200+ pages, hundreds of equations) scroll smoothly without crashing the DOM.
Which download format is best for AI/LLMs?
Both Markdown and JSON work great. Use Markdown for direct LLM chat and human readability. Use JSON for structured pipelines, generating new content, or building automation.
How do I export the dependency graph?
Graph export is not currently supported. If this is critical for your use case, please reach out to support@sciencestack.ai.